Stephen Cannings | 24 Oct 2018

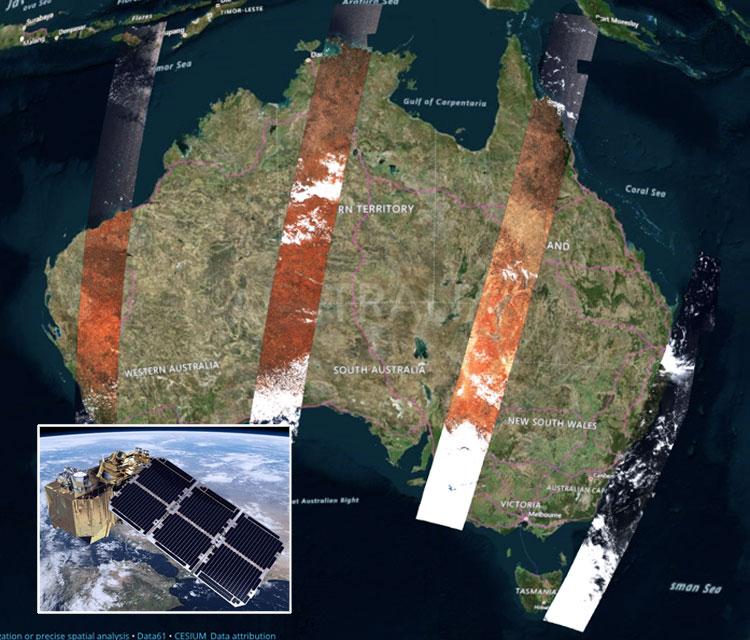
New open data satellite images capture our continent in a new way. Updated every few days, these ‘earth-selfies’ show us the real Australia, clouds, droughts and all.
You are familiar with Google satellite images, right? But to see recent map and earth satellite images you probably need to live in a big U.S. city–in New York, they are updated weekly. For the rest of us, it may take months or even years before a refresh.
Also, these images make things look pretty and green. The endless blue skies (or put it another way, the lack of clouds) is a sure sign they are hand-selected, combined and enhanced.
The Sentinel-2 satellite images recently offered as open data allow us to see recent snapshots across Australia, updated every few days, to provide quite a different view to Google’s idyllic imagery.
While the resolution is not as high, and the purpose not the same as Google’s, you do get a couple of unique features. You can go back in time and view past images from the last 90 days (the service started 7 September 2018) and the inclusion of multi-spectral data lets us view vegetation, bodies of water and urban land cover.
Some of the practical applications include monitoring floods and droughts, tracking changes to vegetation, forests and coastlines and seeing the effects of fires and changes in climate. The images also contribute to disaster mapping and helping humanitarian relief efforts.
You can view this imagery now by loading Sentinel-2 data (from both satellites, 2A and 2B) into NationalMap, the Digital Transformation Agency’s open data visualisation tool.
Images are taken across the Australian continent from the same angle every 5 days. Images are often updated more frequently in overlapping images from different angles.
Open NationalMap.gov.au
Select Add data > Satellite imagery > Sentinel-2 A
Then click on 'Add to map' (in top right) .
Repeat for Sentinel-2 B
Select dates to find satellite pathways over the desired area
Zoom in to reveal the imagery
Here is a selection of amazing NationalMap Sentinel-2 views:
If you want to share a NationalMap view with others simply select Share (in the top right).
To compare two map views with a slider, try using split view (video tutorial).
The satellites are run by the European Space Agency and contribute to the Copernicus program. Digital Earth Australia (DEA) manages the data loaded into the NationalMap; as part of Geoscience Australia they are a key contributor to the Copernicus Australasia regional hub.
David Gavin, Director DEA Technologies, says the department is working with Australian Industry sectors to harness satellite-derived data to "deliver new insights into the Australian continent to the Australian public and grow the Australian economy".
Sentinel-2A was launched on 23 June 2015 while Sentinel-2B followed on 7 March 2017.
Future plans include opening the historical archive of Sentinel 2A and 2B observations to NationalMap, plus delivering the current Landsat 7 and 8 satellite data in near real-time. Both projects are in partnership with National Computational Infrastructure and expected to be available at the end of the year.
These satellites possess the following capabilities:
To track the position of the Sentinel-2 satellites in real-time, download the Sentinel App on iTunes and Google.
For further definition, users can choose from the styles menu to view multi-spectral data – 15 bands in the visible, near-infrared, and shortwave infrared part of the spectrum.
There are several views you can render, everything from Simple RGB to Spectral Bands and Normalised Indexes.
Find out more in the Communities of Practice: Sentinel-2 images - using multi-spectral data
We now have a communities page where you can ask questions and find the latest announcements about open data.